PFAS doesn’t dissolve. It self-assembles — and keeps shedding for centuries.
A bulk water sample reports an average. It can’t see the structured film at the
air–water interface, the colloidal source still growing at the capillary fringe,
or the mass standard methods miss entirely. GeoRheo measures the formulation as
what it actually is — and finds the active source in weeks, not years.
Scroll
Active Source — Still Shedding
Plume — What’s Already Spread
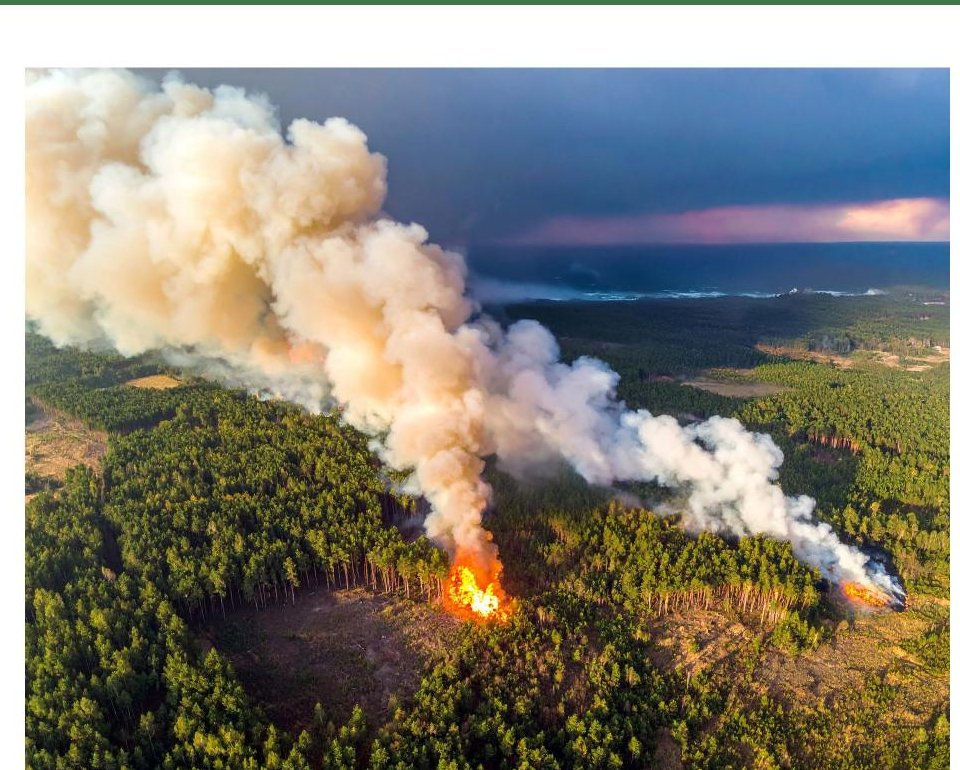
PFAS sheds like fire sheds smoke
The fire is the source. The smoke is the plume. Most investigations only map the smoke.
A spent AFFF formulation behaves the same way: a structured, self-sustaining
active source continues to shed PFAS into groundwater — sometimes
for centuries — while the dissolved plume spreads outward and dilutes.
Standard sampling sees the plume. GeoRheo finds the fire — the functional,
structured source zone that’s still burning — so treatment goes where it
actually stops the shedding, not just where the smoke happens to be thickest.
01 — The Functionality Gap
A bulk water sample tells you the average. It doesn’t tell you where the PFAS actually is.
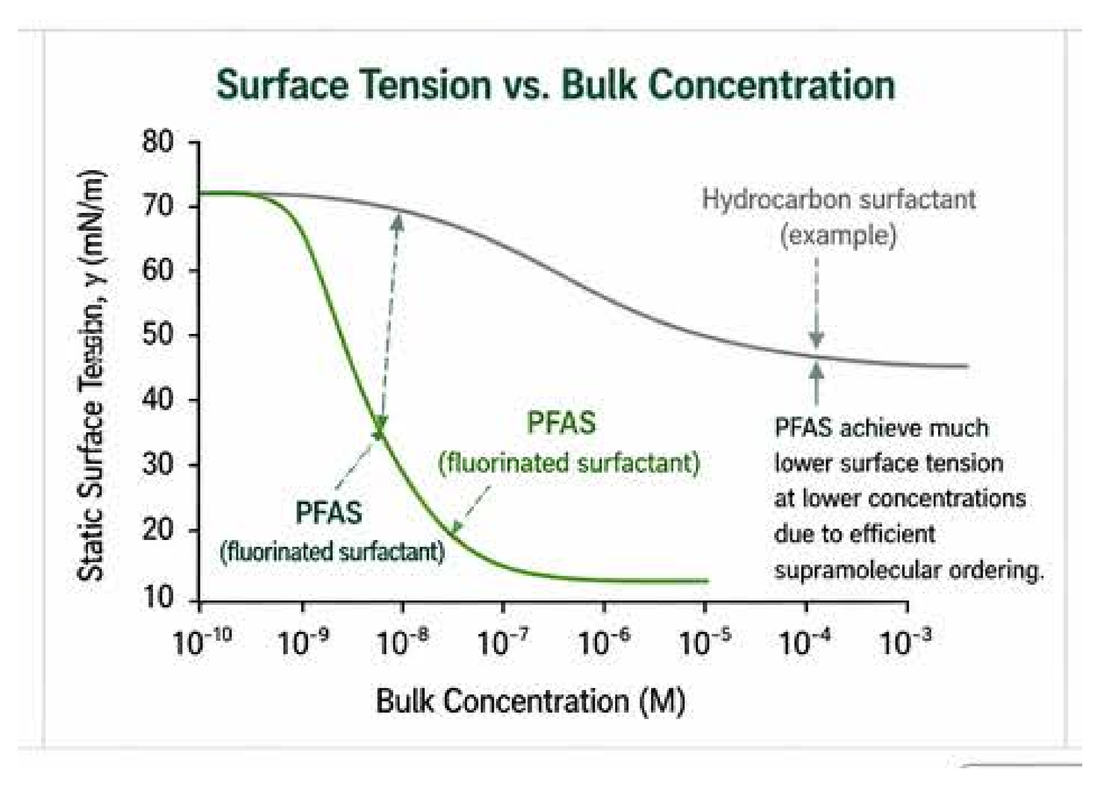
PFAS molecules are amphiphilic — one end loves water, the other end pushes away from it.
Given the chance, they migrate to the air–water interface and pack into ordered films.
As concentration rises toward the Critical Micelle Concentration (CMC), this enrichment
accelerates sharply, then plateaus once the interface saturates. The same bulk
concentration can therefore translate into a very different exposure picture.
Static surface tension collapses as PFAS self-assembles at the interface — at concentrations orders of magnitude lower than a conventional surfactant would need to do the same.
02 — The Functional-State Continuum
GeoRheo doesn’t classify PFAS by compound. It classifies the formulation by behavior.
Every site sits somewhere on a continuum from dispersed monomers to a structured,
interface-dominated system. The further right, the more the bulk concentration
underestimates true exposure — and the more a site behaves less like a dissolved
contaminant and more like a light non-aqueous phase liquid (LNAPL) that keeps shedding
mass for decades.
01 / NON-FUNCTIONAL
Dispersive
Dilute, homogeneous, bulk-dominated. PFAS exists as separated monomers moving apart. Minimal surface tension change, no foam persistence.
Interface-dominated and dynamic. Strong surface tension depression, stable foams and films, high rheological response — an active, self-sustaining source.
Fstate3.0 – 10+ Bulk-only sampling significantly underestimates exposure and risk.
Example: a measured bulk concentration of 12 ng/L, in a fully functional
system (Φ = 0.55), corresponds to an effective concentration of roughly 26 ng/L —
a 2.2× risk amplification that a standard bulk-only Hazard Index never sees.
IRIS toxicity values (RfD, CSF) don’t change. What changes is how much of the measured
mass is actually available to reach a receptor — and GeoRheo measures that directly,
using surface tension, foam stability, interfacial enrichment, and rheological response.
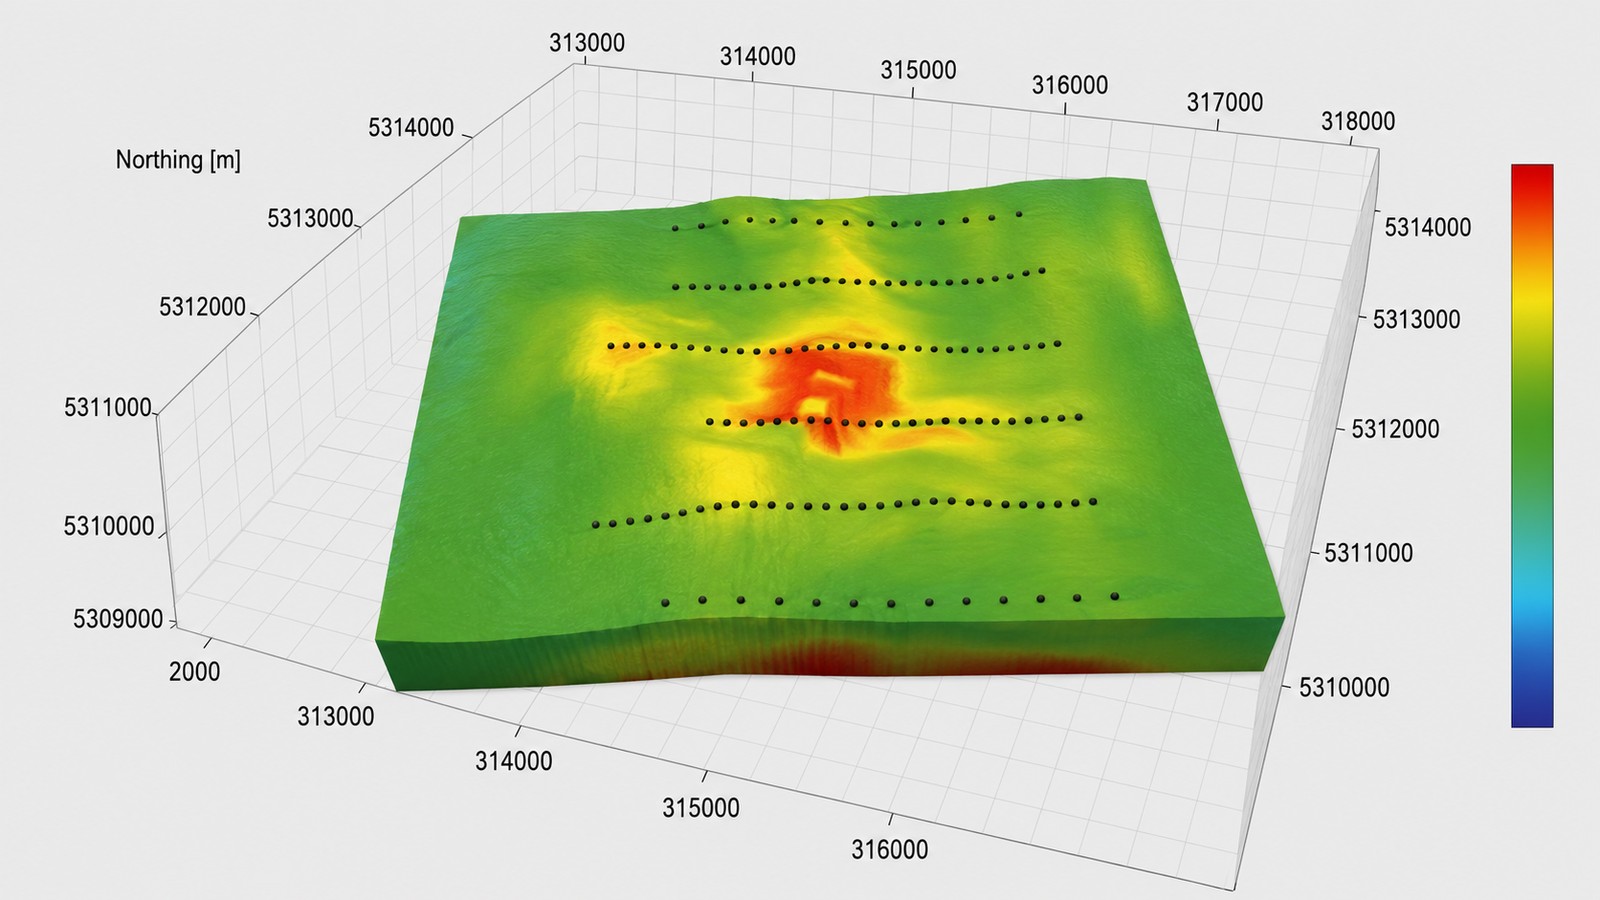
Field data: static surface tension (SST) across 59 GeoRheo measurement points. The red zone marks where the formulation is fully functional — surface tension drops sharply, signaling an active, structured source at the capillary fringe. Everywhere else reads as background.
03 — From Diagnosis to Treatment
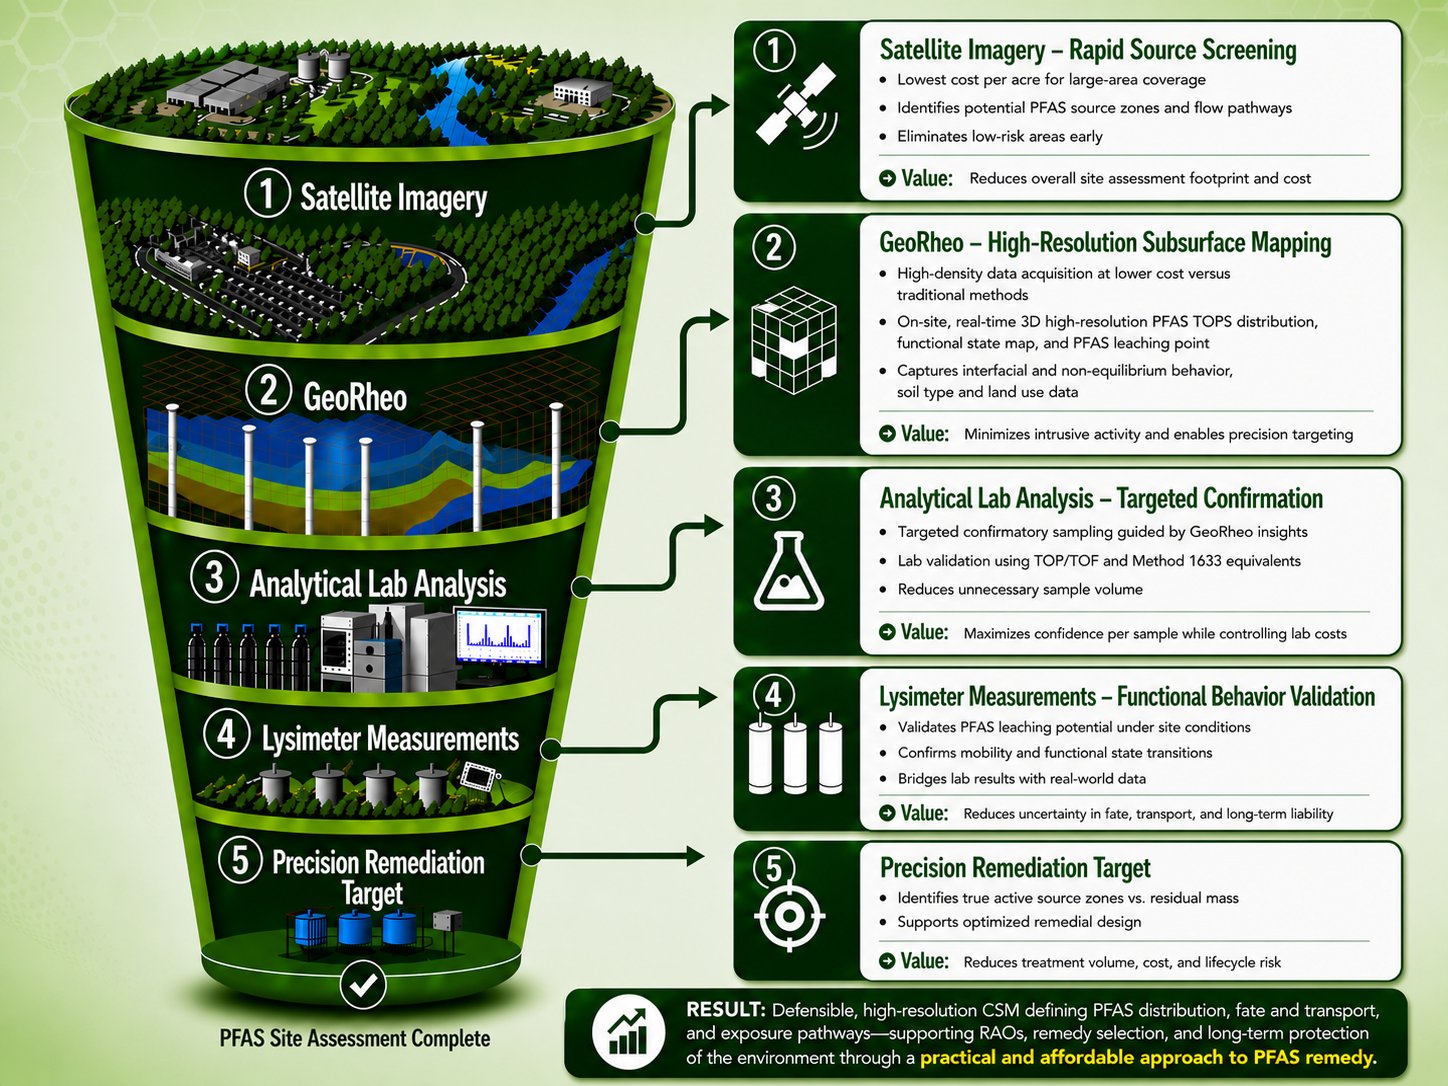
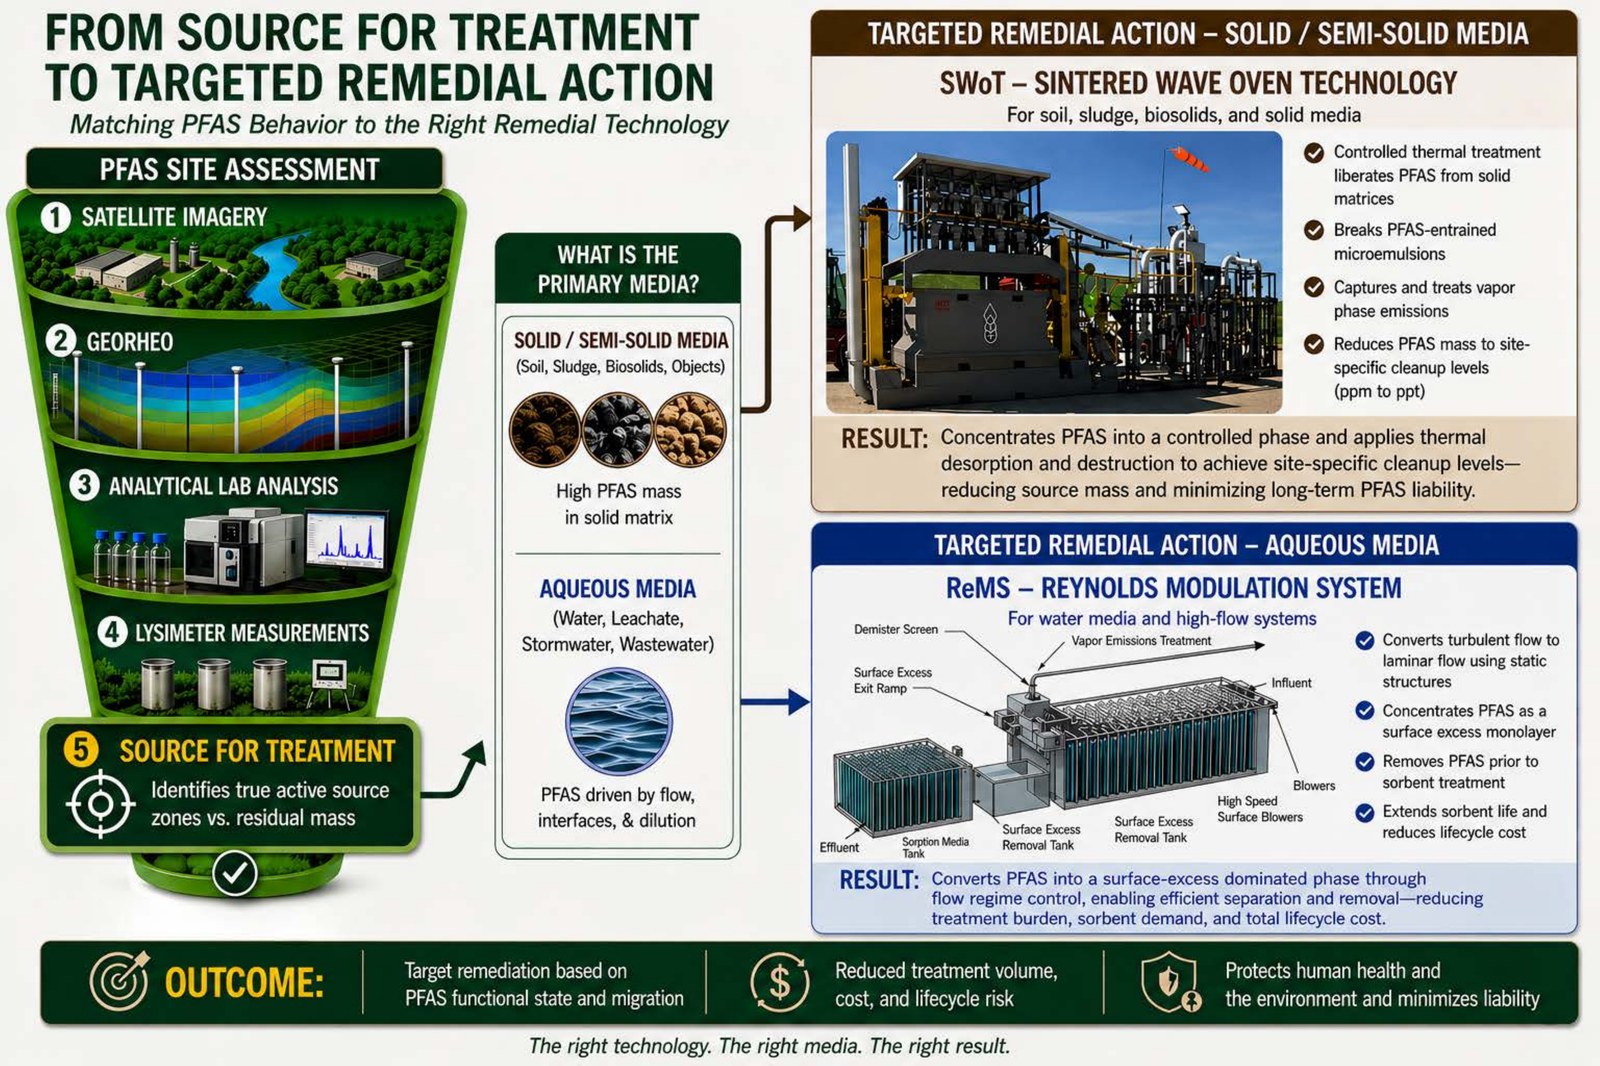
GeoRheo finds it. SWoT and ReMS treat it — in soil or in water.
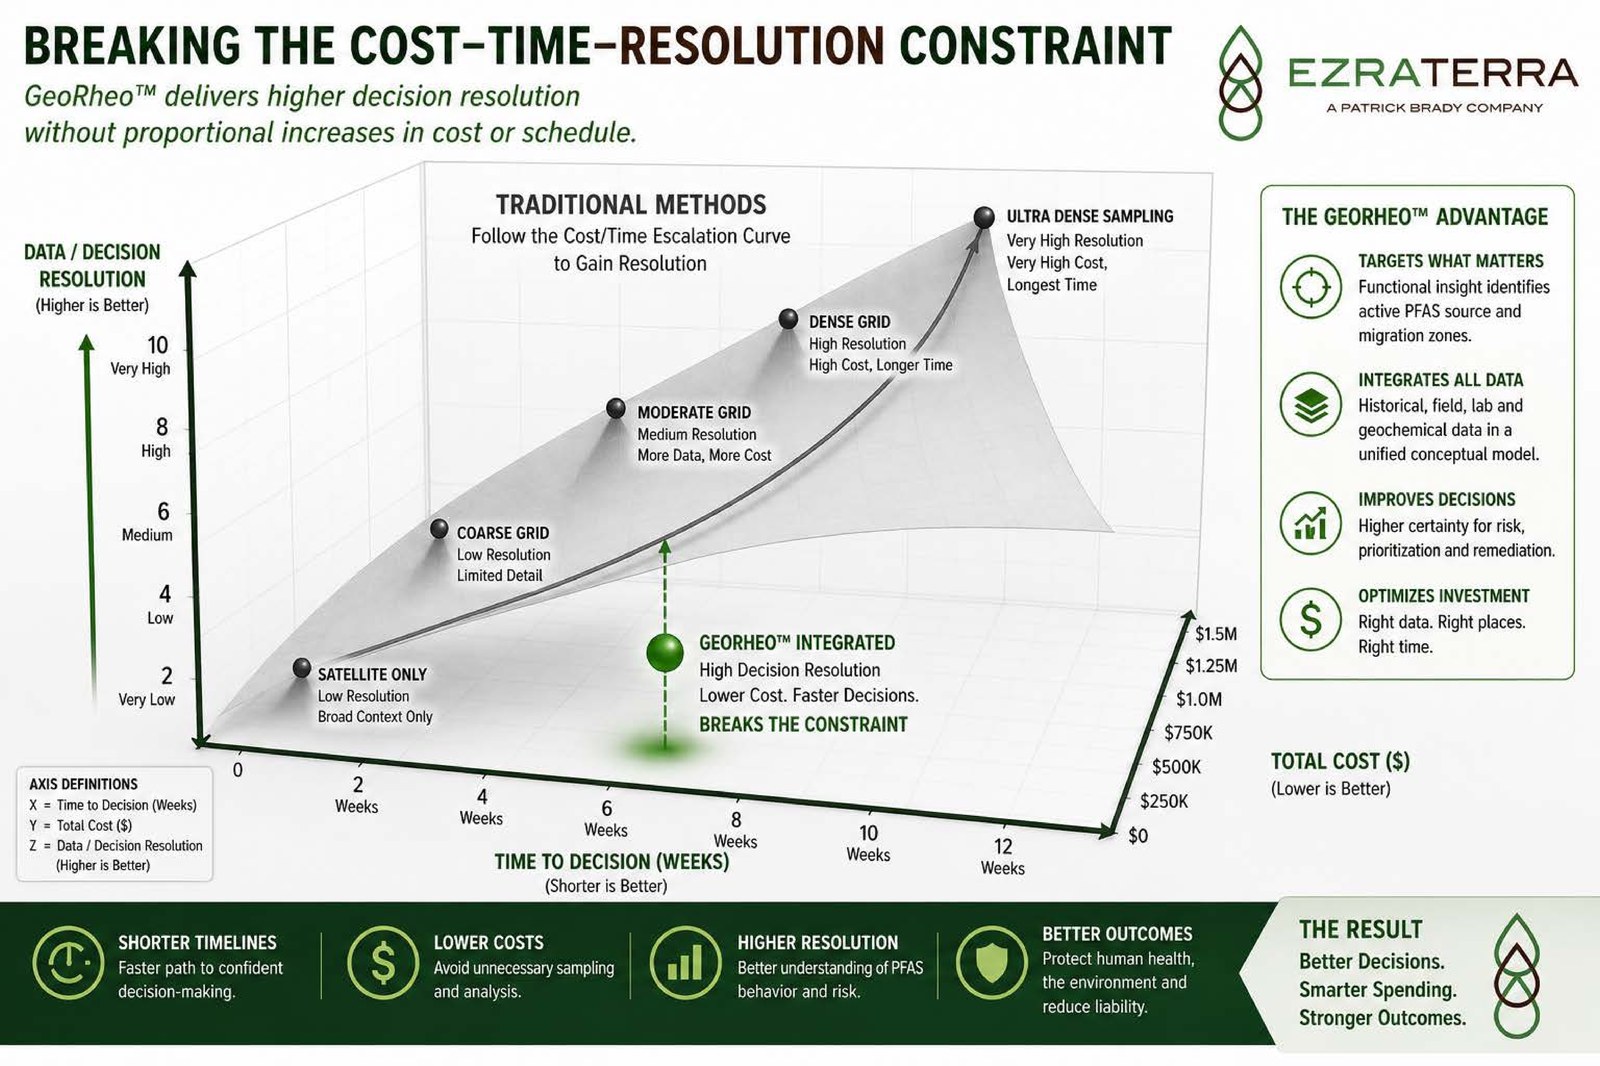
Traditional methods follow a cost/time escalation curve: more resolution always means
more sampling, more weeks, more cost. GeoRheo integrates multi-scale data and interfacial
science to break that curve — and SWoT’s low-energy thermal process treats what GeoRheo finds,
in place, with quantitative pre/post verification.
Traditional methods trade cost and time for resolution along this curve. GeoRheo’s integrated approach reaches the same — or higher — decision resolution without following it.
04 — The Portfolio
Three patented technologies, one rheological framework — soil, water, and everything between.
GeoRheo, SWoT, and ReMS share the same underlying premise: PFAS-stabilized formulations
behave as structured fluids, and that structure can be measured, exploited, and broken
down with the same instruments used to design AFFF in the first place. Each technology
targets a different stage and matrix.
Diagnose
GeoRheo™
Soil · Water · Sludge
Rheological Assay Technology delivers on-site total PFAS and TOPs concentration,
plus functional state, within minutes — using the same instruments AFFF manufacturers
use to formulate the product in the first place.
Surface tension → CMC position → Fstate
Treat — Solid Matrices
SWoT™
Soil · Sludge · Objects · Vapor
Sintered Wave Oven Technology uses low-energy thermal treatment to break the
formulation’s structure, liberating and condensing PFAS to site-specific cleanup
levels — without the extreme heat or destructive reagents of conventional thermal
desorption.
The Reynolds Number Modulation System converts turbulent flow to laminar flow,
allowing PFAS to be removed as a surface-excess monolayer at the air–water
interface — the same enrichment effect GeoRheo measures — then optimizes
sorbent adhesion downstream.
Identify the active source. Treat only what’s shedding. Verify it’s gone.
Across documented site applications, integrating GeoRheo characterization with SWoT
treatment consistently narrows the remedial footprint to the zones that are actually
contributing to groundwater impact.
$2.75M+
3-year savings, per site
~6 wks
to decision vs. 10–16 traditional
40–60%
lower total project cost
6 mo
typical payback period
Combined business case: GeoRheo identifies the active source, SWoT treats it, and pre/post testing verifies the result — the basis for the figures above. Click to open full size.
Let’s talk about your site
Bring us a site that’s been resistant to closure — we’ll show you what GeoRheo sees that bulk sampling didn’t.
Patrick donated site remediation and consulting services to bring a Portland Brownfield site to closure. All remediation costs were born by Patrick. The remediation and demolition waste was transported to the Waste Management Hillsboro Landfill. The site became a community Park and community garden.
Rose City Plating: Portland, Oregon
The Rose City Plating property was contaminated with plating fluids, heavy metals, PAHs and hydrocarbons. The site was located in the middle of the historic Sellwood District of Portland. The property was a blight on the community, which prevented new businesses from entering the area. We complete building decontamination and demolition. We removed impacted soil and various underground tanks located during remedial activities. The site was returned to value and now hosts the County Library and high end town homes on the upper floors of the development.
Iron Partners Property: Vancouver, Washington
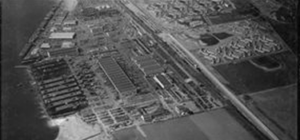
Ezraterra staff completed a site investigation and complete remediation of a historic landfill containing hazardous waste adjacent to the Columbia River using a unique technology-centered approach. At the onset of WWII, the United States granted Kaiser Shipyards a contract to rapidly build liberty ships to support the war effort. The Kaiser Shipyard in Vancouver, Washington was located on the Columbia River. During manufacturing, debris and hazardous wastes were deposited in a landfill adjacent to the Columbia River.
Confidential ClienT: Fullerton, California
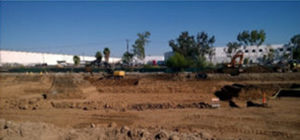
Confidential Client company manufactured medical devices at the Fullerton Plant since the 1950s. Chlorinated hydrocarbons were detected in soil and groundwater during a RCRA closure investigation. The site was overseen by the California Department of Toxics Substance Control (DTSC). The consultant of record expected the remedy to take decades to complete. Soil was initially excavated and treated with Evaporative Desorption under a pilot testing program. South Coast Air Quality Management District issued air permits to operate. The DTSC authorized continued pilot testing operations until 100,000 tons were treated to non detectable concentrations in soil matrix and soil vapor. The site was closed before the Corrective Measure Study was completed by the consultants. The project was completed in less than one year.
Togiak Fisheries: Togiak, Alaska
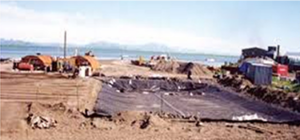
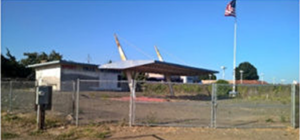
Togiak Fisheries is located in a remote Alaska in northern Bristol Bay. The site is only accessed by sea or air; no roads.
Togiak Fisheries historically used diesel and gasoline to fuel electrical generators for their freeze plant and camp operations.
I-5 Truck Stop: Canyonville, Oregon
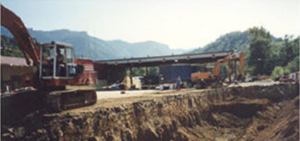
The Fat Harvey’s Truck Stop in Canyonville was contaminated with gasoline and diesel from leaking underground tanks and a historical bulk plant. Soil was excavated and treated onsite. A new $12 Million truck stop was developed in its place creating hundreds of jobs.
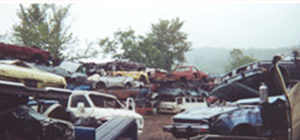
The P&A Auto Wrecking yard was a long standing blighted area ridden with crime. The property consisted of 12.5 acres of prime industrial land. There were 3,500 wrecked automobiles on the site and thousands of tons of other related debris. The site was located adjacent to a Superfund site and five other contaminated properties. The groundwater had commingled plumes from multiple sources.
Brownfield Portfolio: Klamath Falls, Oregon
Patrick acquired four brownfield properties in Klamath Falls, Oregon. The properties consisted of one service station, two bulk plants and a former meat packing plant and had been investigated and managed by consultants for decades with no results. These properties were formerly owned by Unocal, Texaco, Chevron and Regal Stations. Soil and ground water were impacted at all the properties. Soil was excavated and treated with Evaporative Desorption. The sites were all closed in less than one year under Oregon Department of Environmental Quality Oversight. The projects were toured by the Oregon Environmental Quality Commissioners (Governor Appointees). The success of the projects led to a Chevron contract to perform soil treatment services.
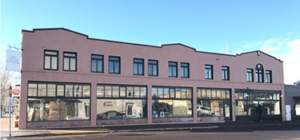
EzraTerra recently completed a renovation of a downtown historic building; the building was disentangled from a regional gasoline groundwater plume. The lower floor is currently leased as retail space. The second floor was developed into an extended stay hotel for Facebook and Apple data farm construction workers. The Main Street Bunkhouse house brings high-wage earners to the downtown core of Prineville.
APATITE METAL STABILIZATION TECHNOLOGY
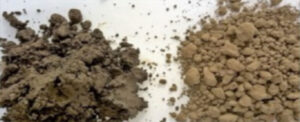
Ezraterra acquired the Apatite Metal Stabilization Technology to handle metal contaminated porous media (soil and sediment). The technology uses a proprietary process to chemically stabilize the metals in soil or sediment by bonding the metals to the soil or sediment. The process addresses the ability for the metals to leach from the soil. The EPA defines RCRA characteristic hazardous waste through a leaching analysis (TCLP). The Apatite metal stabilization treatment process will take elevated TCLP soils and render the soil non-hazardous, which allow the soils to be disposed at a non-hazardous waste landfill at significant cost savings.
PERMEATION BED TREATMENT TECHNOLOGY
The permeation bed treatment technology is an excavation equipment compatible device. Wheel loaders can freely enter the treatment chamber for loading and unloading the soil. The technology is a static pile arrangement using flameless heat sources. The soil is treated through drawing hot air from a permeation bed, which consists of a large rock bed heating through hot air injection. The rock bed stores the heat, which lowers energy costs.
PERMAFROST MELT PROTECTION
Our technology protects the permafrost; it also reduces the volume of gravel needed for new roads and facility pads resulting in significant cost savings. We use natural materials and the arctic environment to create an insulating layer to protect the new infrastructure from permafrost melt.
SINTERED WAVE TECHNOLOGY®
Sintered Wave Technology® uses enhanced capillary flow as a primary mechanism for containment transport.